监控
HoraeDB 支持使用 Prometheus 和 Grafana 做自监控。
Prometheus
Prometheus 是非常流行的系统和服务监控系统。
配置
把下面的配置保存到 prometheus.yml 文件中。比如,在 tmp 目录下,文件地址为 /tmp/prometheus.yml。
有两个 HoraeDB http 服务启动在 localhost:5440、localhost:5441。
| |
Prometheus 详细配置见这里。
运行
你可以使用 docker 来运行 Prometheus。Docker 镜像在这里可以找到。
docker run \
    -d --name=prometheus \
    -p 9090:9090 \
    -v /tmp/prometheus.yml:/etc/prometheus/prometheus.yml \
    prom/prometheus:v2.41.0
更多 Prometheus 安装方法,参考这里。
Grafana
Grafana 是一个非常流行的可观察性和数据可视化平台。
运行
你可以使用 docker 来运行 Grafana。Docker 镜像在这里可以找到。
docker run -d --name=grafana -p 3000:3000 grafana/grafana:9.3.6
默认用户密码是 admin/admin.
运行上面命令后,grafana 可以用浏览器打开 http://127.0.0.1:3000。
更多 Grafana 安装方法,参考这里。
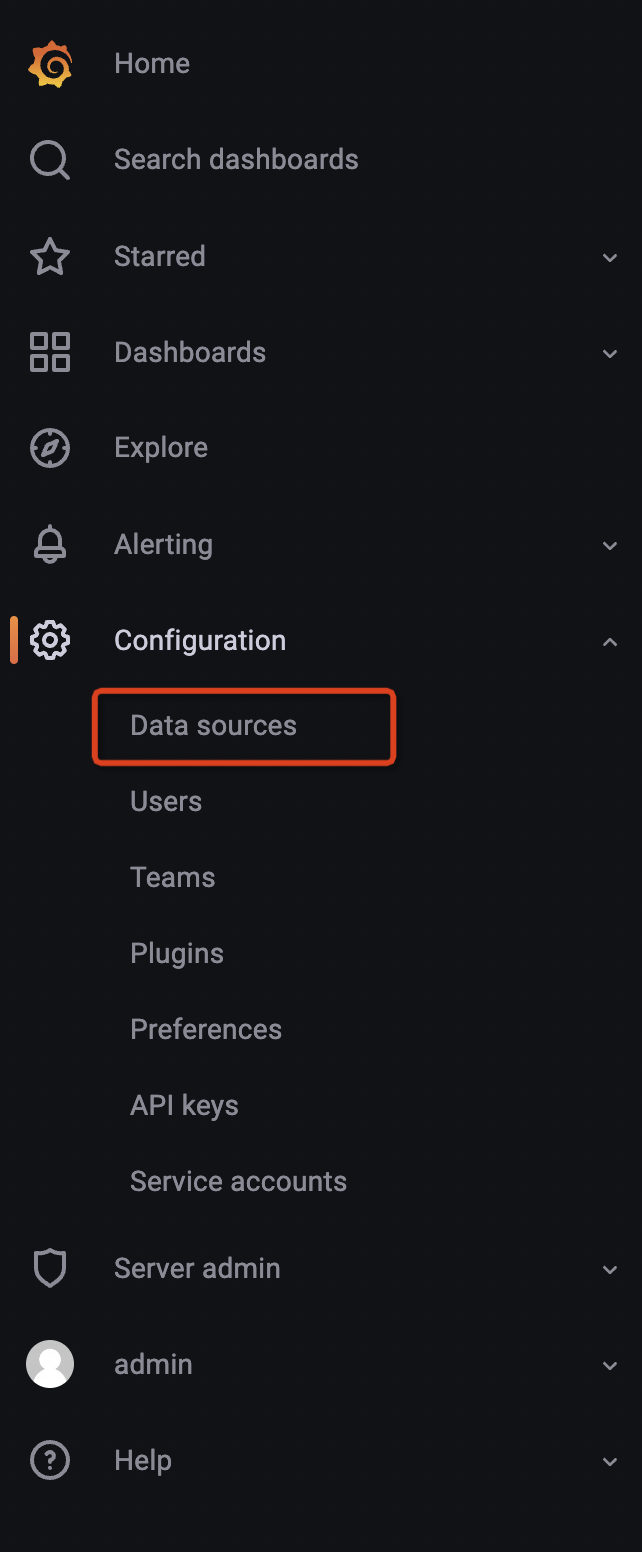
配置数据源
- 将光标悬停在配置(齿轮)图标上。
- 选择数据源。
- 选择 Prometheus 数据源。
注意: Prometheus 的 url 需要填写成这样 http://your_ip:9090, your_ip 换成本地地址。
更详细的配置可以参考这里。
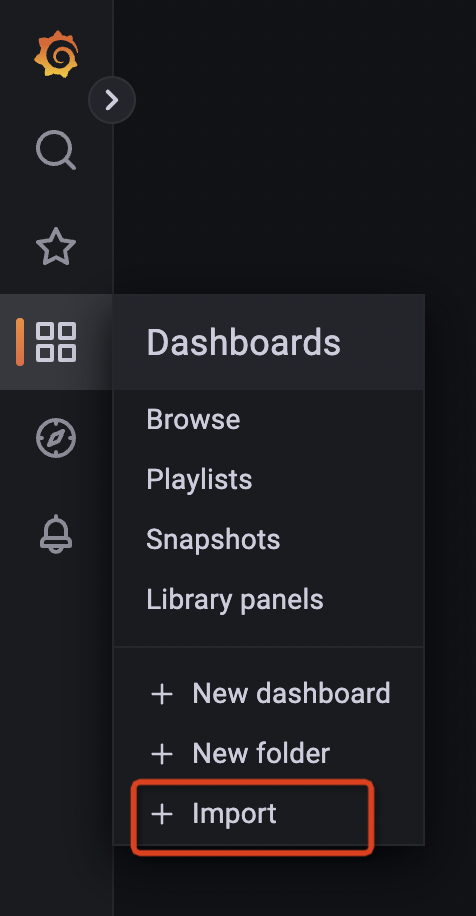
导入监控页面
HoraeDB 指标
当导入完成后,你可以看到如下页面:
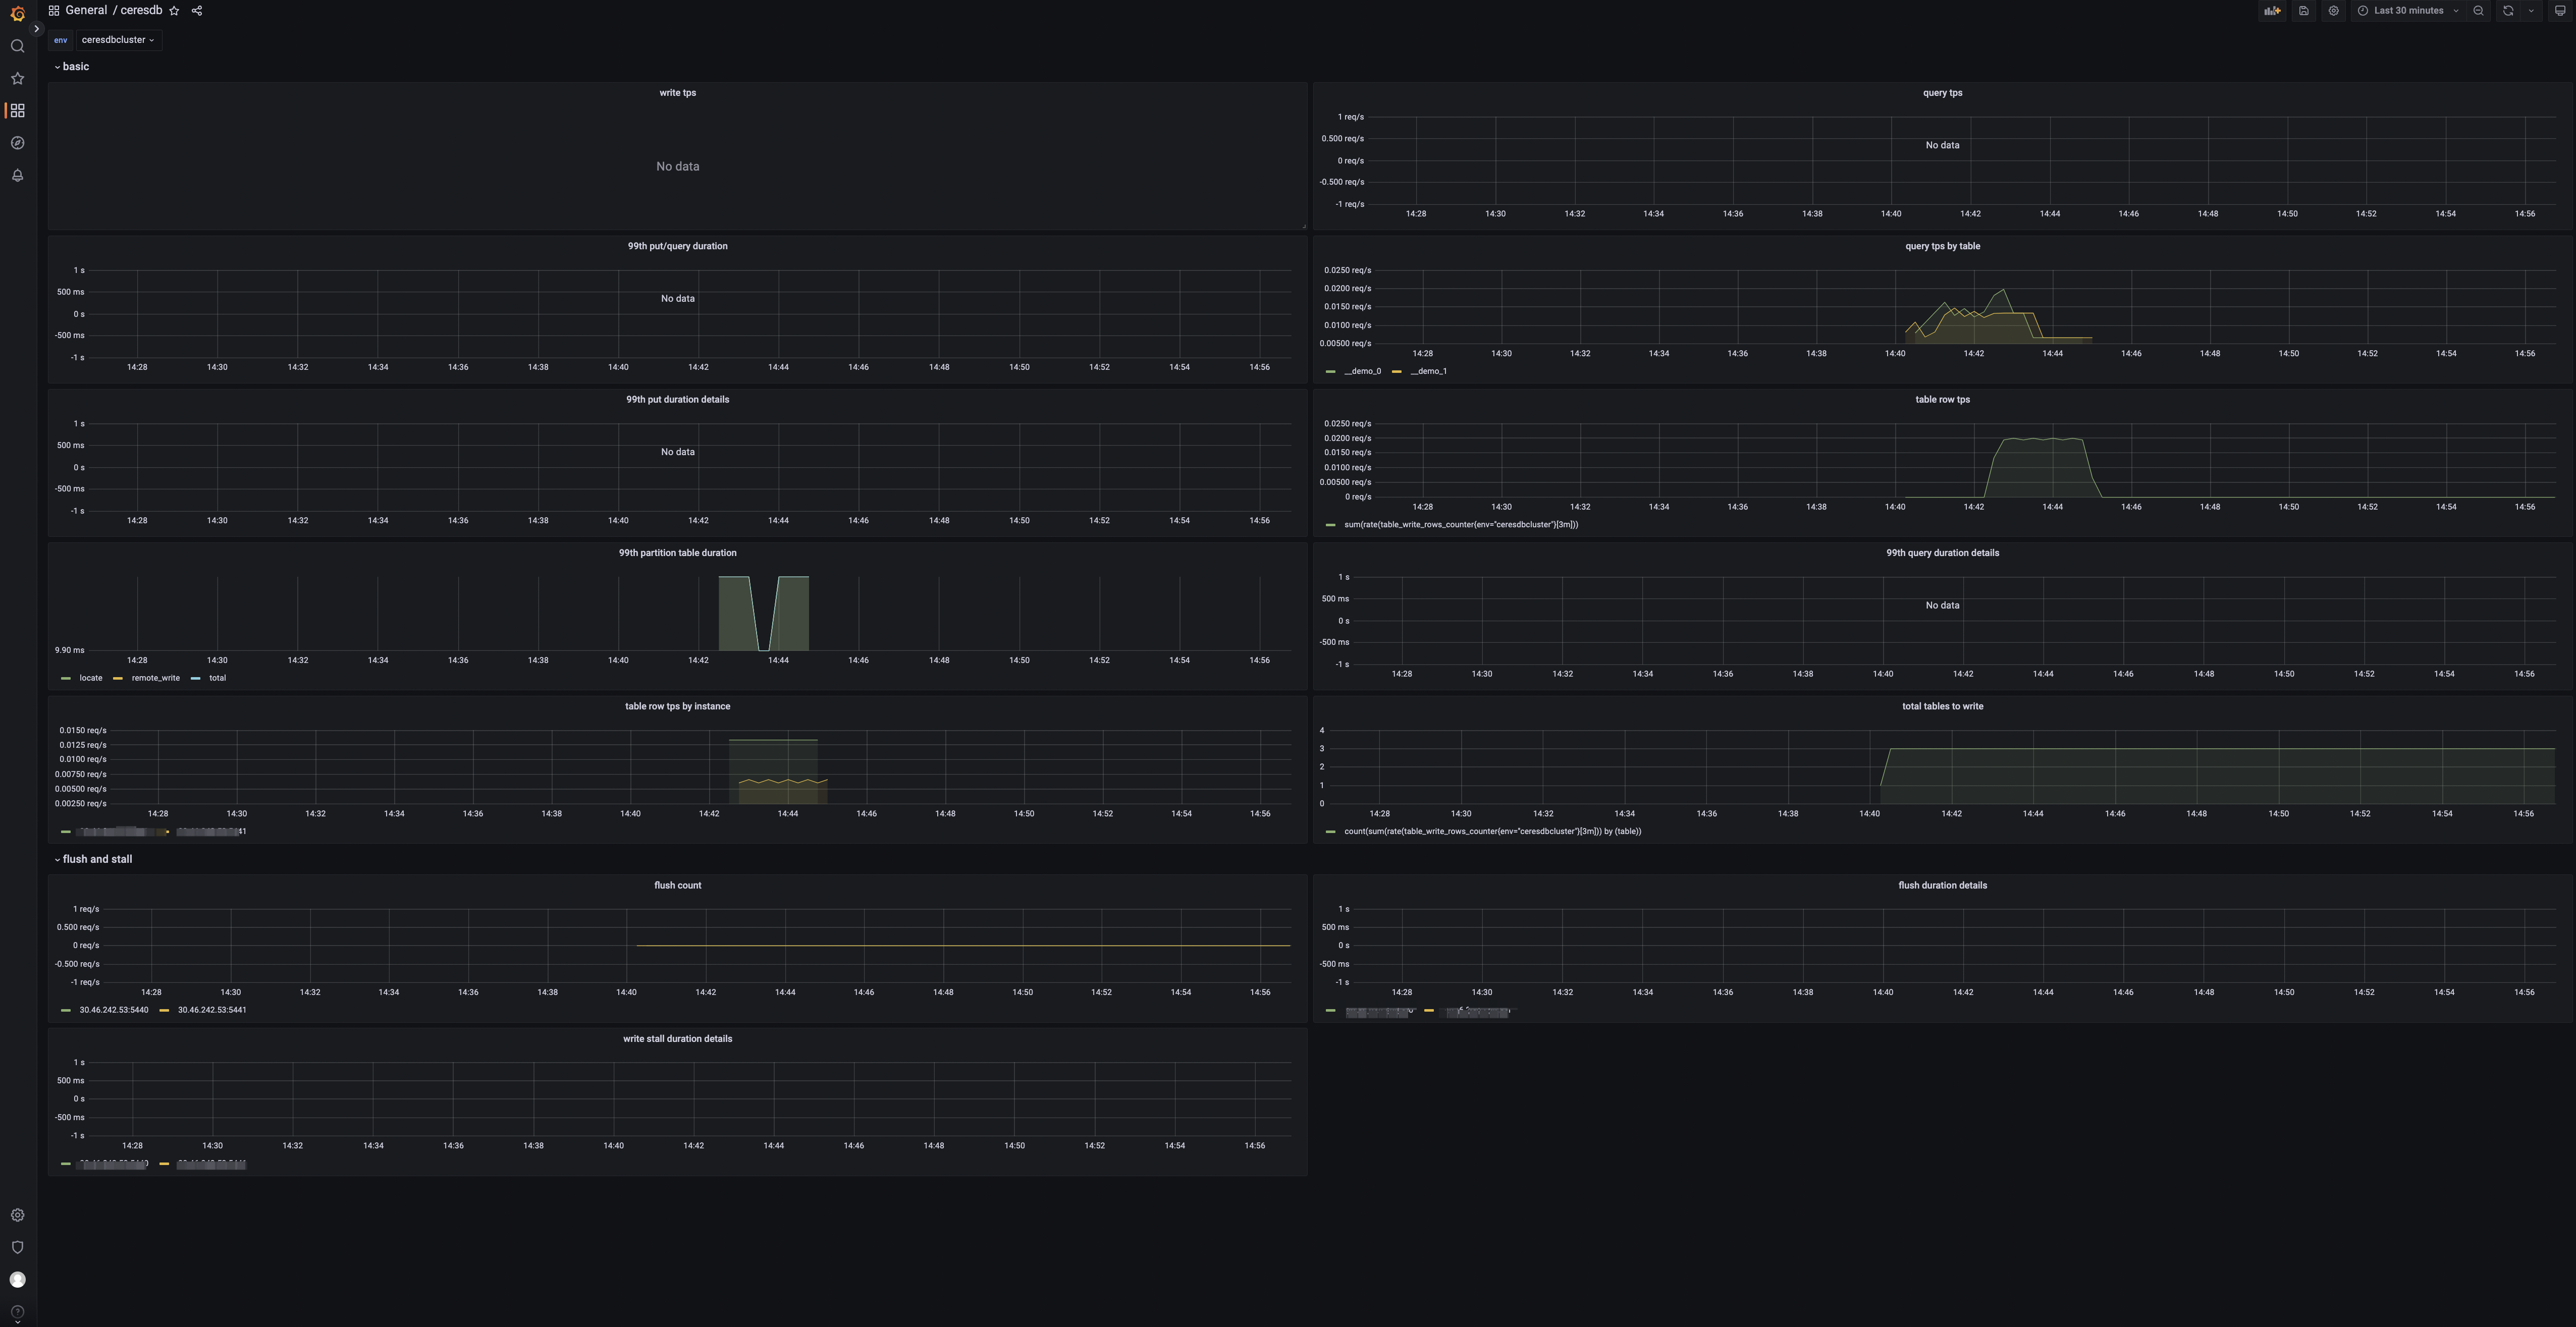
Panels
- tps: 集群写入请求数。
- qps: 集群查询请求数。
- 99th query/write duration: 查询写入的 99% 分位数。
- table query by table: 表查询请求数。
- 99th write duration details by instance: 写入耗时的 99% 分位数。
- 99th query duration details by instance: 查询耗时的 99% 分位数。
- 99th write partition table duration: 分区表查询耗时的 99% 分位数。
- table rows: 表的写入行数。
- table rows by instance: 实例级别的写入行数。
- total tables to write: 有数据写入的表数目。
- flush count: HoraeDB flush 的次数。
- 99th flush duration details by instance: 实例级别的 flush 耗时的 99% 分位数。
- 99th write stall duration details by instance: 实例级别的写入停顿时间的 99% 分位数 。